No. 6 · Urban heat · Landsat 9 × population register

The June 2026 heatwave, seen from space

On 24 June 2026 around 10.30am, at the height of the heatwave, the Landsat 9 satellite measured the ground temperature of almost the entire country — the west completed on 1 July: up to 65.0 °C at the surface. This page cross-references those measurements, commune by commune, with the population aged 65 and over — and shows where heat and vulnerability stack up.

Data: USGS/NASA Landsat · ACT · RNPP (CC0) Method: published and reproducible Author: Sitraka Forler · LinkedIn Built: 28/07/2026

Key findings

  1. On 24 June, 39 % of the observed surface was above 40 °C; the hottest pixel reached 65.0 °C, on an industrial roof in Bascharage.
  2. The gap plays out as much inside communes as between them: 17.1 °C separate the built core from the cool zones in Esch-sur-Alzette.
  3. 348,144 residents lived in a commune where more than half the ground exceeded 40 °C (50 % of the country’s population).
  4. 21 communes combine heat and age above the medians; that is where the health risk concentrates.
65.0 °C
the hottest surface measured in Luxembourg on 24 June
39 %
of the surface observed on 24 June above 40 °C
13 °C
of spread between communes, same day, same hour
21 communes
sit above the 24 June medians for both heat and share of over-65s
149,067 people
live in these 21 communes where the risks stack up
01

What the satellite saw

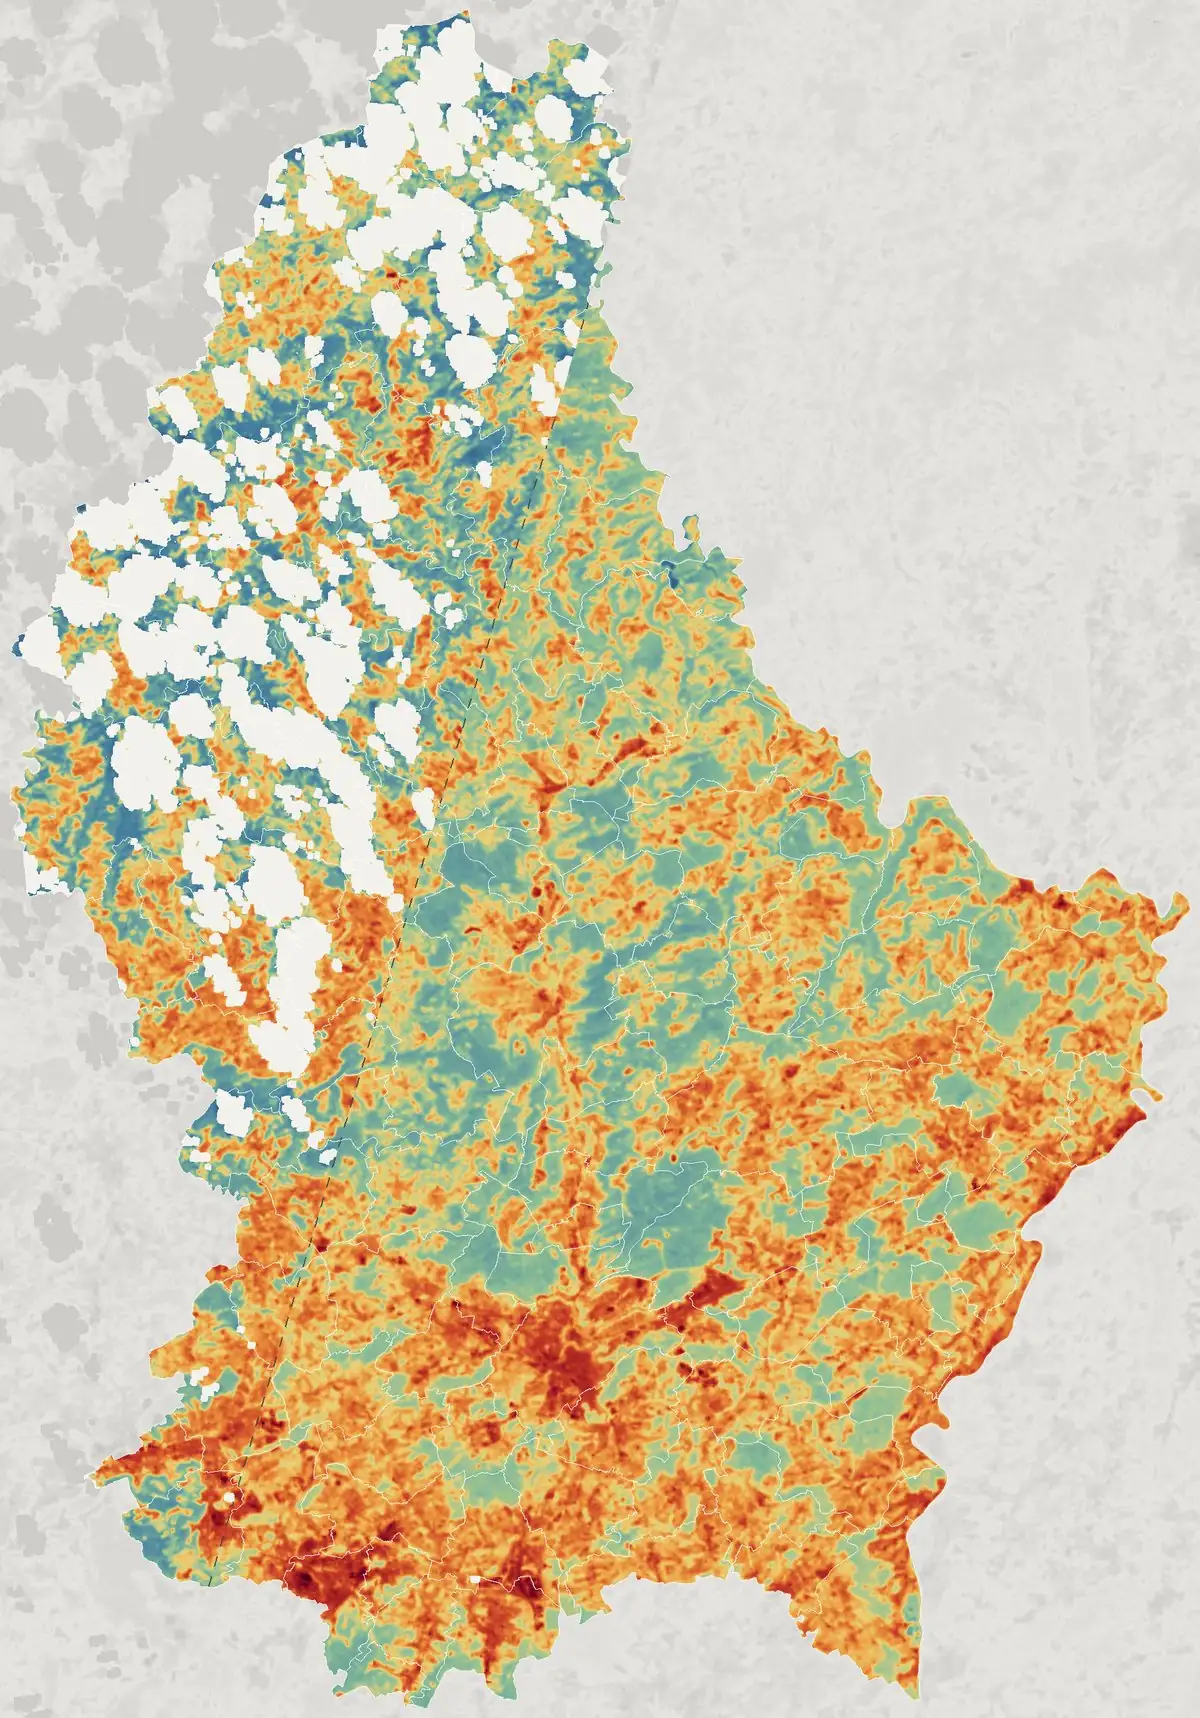
Each pixel covers 100 m × 100 m. The dark red is roofs, car parks and business parks; the sea green, forests and valleys. Esch and the southern belt stand out at once — but pockets of heat also appear in Remich, Grevenmacher and around the airport.

Map of Luxembourg’s land-surface temperature on 24 June 2026, measured by Landsat 9 1 July · harmonised +6.3 °C 24 June · peak of the heatwave

Surface temperature

24 °C3848≥ 62 °C
À gauche du liseré pointillé : passage du 1ᵉʳ juillet (le 24 juin, le satellite ne survolait pas cet angle), affiché harmonisé de +6,3 °C — l’écart médian mesuré sur 4,2 millions de pixels de recouvrement. Les taches claires sont ses nuages, masqués. Aucun classement ne mélange les deux dates.
This is ground temperature, not air temperature: ground at 50 °C coexists with much lower air. It is the heat that surfaces store, then partly release back at night.
02

The country, degree by degree

Across the 1,602 km² observed on 24 June — 62 % of the territory, the north-west not having been overflown that day — the surface splits between a cool mode around 34-36 °C (forests, farmland, valleys) and a broad shoulder above 40 °C (roofs, roads, business parks); the median falls between the two, at 38.7 °C. 39 % of that observed surface exceeded 40 °C, 0.9 % exceeded 50 °C. Set against the whole country the figure would be lower: the missing part is the coolest.

Distribution of the national surface by temperature, 24 June pass (30 m grid, ~100 m native information). The line marks the 40 °C threshold; the median is indicated.

348,144 residents lived in a commune where more than half the ground exceeded 40 °C — 63 % of the communes observed that day, 50 % of the country’s population.

Read at commune scale: a commune’s population is set against the hot share of its territory, without pinpointing residents within it. Base: the 72 communes observed on 24 June, i.e. 550,817 residents; the other 28 (143,090 residents) were not seen during the peak.

03

Commune by commune

Same day, same hour: the 95th percentile of surface temperature runs from 53.4 °C in Esch-sur-Alzette to 40.4 °C in Larochette — a 13 °C gap that reflects geography, building density and vegetation. Pick an indicator:

Western-band communes: measured on the 1 July pass (episode over, −6.3 °C measured gap) — their thermal values are not comparable with those of 24 June and are not ranked with them. The table keeps their raw values; only the map and the choropleth show the harmonised version. The share of over-65s (population register) does not depend on the date. ° 24 June communes where more than a quarter of the territory was only seen on 1 July: partial coverage, statistics to be read with caution.

04

The contrast plays out inside the communes

A communal average hides a lot: for an adaptation policy, what matters is the gap between a commune’s built core and its cool spaces. This intra-commune thermal range — the 95th percentile minus the 25th — reaches 17.1 °C in Esch-sur-Alzette: the commune holds both very hot islands and cool pockets, and therefore room for manoeuvre. A small range does not mean a cool territory: Frisange shows only 6.1 °C of range, but 72.7 % of its ground exceeded 40 °C — hot almost everywhere, and so without a cool reserve nearby.

The 15 communes with the largest internal range (24 June). The bar runs from the 25th percentile (cool zones) to the 95th (built core) of each commune. This is not an urban heat island index in the strict sense: there is no rural reference, and the result depends on communal boundaries.

05

Where heat meets vulnerability

A hot, young commune does not have the same problem as a hot, ageing one. The top-right quadrant — hotter and older than the median of the 72 communes observed on 24 June — concentrates the health risk: it includes Mondorf-les-Bains, Remich and Niederanven, where more than one resident in five is 65 or over. Circle size shows the number of residents aged 65 and over.

06

By canton, where the satellite passed

Aggregated by canton — and only over the communes seen on 24 June — the gaps narrow: from 49.8 °C in the Esch-sur-Alzette canton to 41.6 °C in the Vianden one. Four north-western cantons are too sparsely covered that day to be compared: their absence is precisely what rules out concluding a “north-south gradient”, since the coolest part of the country was not observed during the peak.

07

Find your commune

Type a commune’s name to see its card: surface heat, internal contrast, share of older residents, and its position in the 24 June ranking.

08

What this map shows — and what it doesn’t

What it shows

  • The surface temperature actually measured (Landsat 9 thermal band, 100 m), on a heatwave morning, with no model and no interpolation.
  • The gaps between communes and between districts of the same commune: business parks, dense centres, forests, valleys.
  • The cross-reference with each commune’s actual age pyramid (national register of natural persons, 1 July 2026).

What it doesn’t show

  • The air temperature people actually feel — ground at 50 °C goes with noticeably “cooler” air, the stored heat being partly released back at night.
  • Detail at street level: 100 m distinguishes neighbourhoods, not streets. For that, the country already has a free national 25 m Klimaanalyse (2018 model) and the southern communes a 5 m analysis — this page complements them with observed 2026 data; it does not replace them.
  • Comparable units: the 95th percentile of a small, dense commune reflects its built-up core; that of a large, wooded one dilutes its heat pockets in the forests — communal boundaries are not neutral.
  • A forecast: this is a photograph of a real episode, not a scenario.
09

Meanwhile, from Bordeaux to Luxembourg: the summer of fires

The heat mapped here is not an isolated phenomenon. As these lines were finalised (28 July 2026), a fire that broke out at Saumos, west of Bordeaux, on 22 July had burned through some 42,000 hectares according to the Gironde prefecture; more than 220,000 people had been evacuated across 24 communes, the Cap Ferret peninsula partly by sea. The fire was “stabilised”, not yet contained. On its own, it is twice the size of Gironde’s historic July 2022 fires (La Teste-de-Buch and Landiras, roughly 21,000 ha combined).

Three reference points, drawn from official tallies and open data, all dated:

Figures as of 28 July 2026; an active fire outdates them within hours. EFFIS totals are rapid satellite estimates (fires of roughly 30 ha and above), continuously revised, and differ from national tallies. One reminder: the surface temperature mapped here measures heat exposure, not directly wildfire risk.
10

For municipalities

Measure 1.1.3 of the Climate Pact 2.0 asks every commune for a heat-stress analysis crossed with its vulnerable population — exactly what this page sketches at national scale. A full adaptation concept can be subsidised up to €25,000 (FCE circular 2025-050).

Your commune, in detail

I prepare commune-level dossiers that combine this satellite observation with the existing public layers (25 m Klimaanalyse, LiDAR canopy, soil sealing, vulnerable population) in the format measure 1.1.3 expects. Climate adviser, alderman or technical department: write to me — the first gap analysis is free.

Request my commune’s dossier

Sitraka Forler, independent analysis, Luxembourg.

Cite this analysis

On 24 June 2026, Landsat 9 measured surface temperatures of up to 65.0 °C in Luxembourg (hottest pixel); 21 communes, home to 149,067 residents, combined heat and a share of over-65s above the medians of the 72 communes observed that day. — S. Forler, “The June 2026 heatwave, seen from space”, canicule.sitraka.lu, data USGS/ACT/RNPP (CC0).
11

Method & sources